


 151 / 536

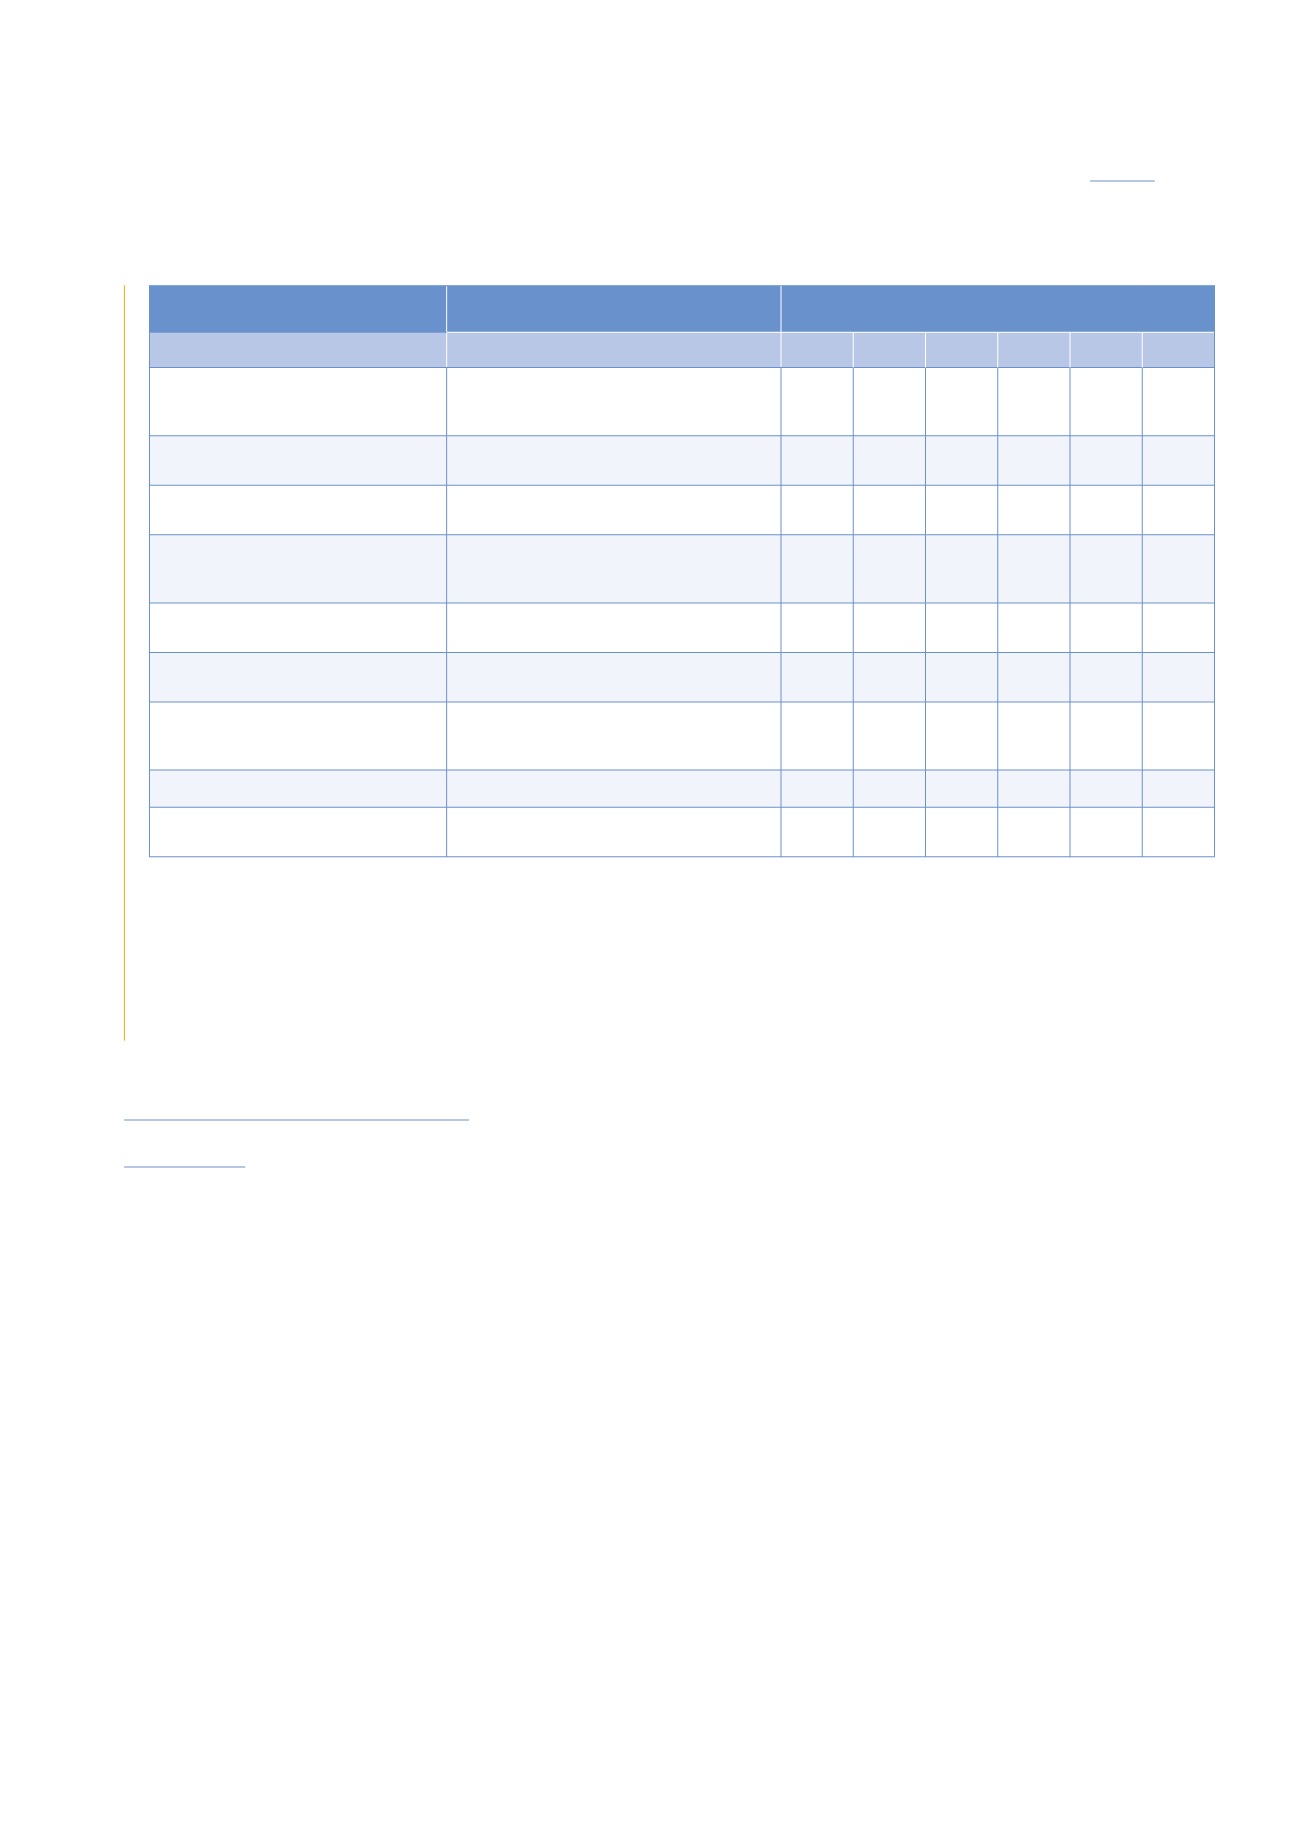
LICENSEE/SITE
MOST EXPOSED REFERENCE GROUP /
DISTANCE TO SITE IN km
ESTIMATION OF RECEIVED DOSES, IN mSv
[POPULATION]
(a)
2009 2010 2011 2012 2013 2014
EDF / Gravelines
Petit-Fort-Philippe / 1.5, Espace Culturel Decaestecker (2009, 2010,
2011, 2012, 2013) / 1.1 / [Adult, Fisherman (2009, 2010, 2011,
2012, 2013)] / Gravelines / 1.8 [Fisherman, Adult 2014]
1.10
-3
1.10
-3
2.10
-3
4.10
-4
6.10
-4
8.10
-4
EDF / Nogent-sur-Seine
Port Saint-Nicolas 2.25, Maison de l’Eclusier (2009, 2010, 2011,
2012, 2013) / 1 [Adult ] [Infant (2013, 2014)]
6.10
-4
9.10
-4
8.10
-4
6.10
-4
1.10
-3
5.10
-4
EDF / Paluel
Le Tôt / 1.5 [Adult, Fisherman (2009, 2010, 2011, 2012)]
Conteville / 1 [Adult, Fisherman] / Saint-Sylvain / 1.4 [Adult 2014]
6.10
-4
7.10
-4
8.10
-4
5.10
-4
9.10
-4
9.10
-4
EDF / Penly
Saint-Martin Plage / 1.1, Vassonville (2009, 2010, 2011, 2012) /
0.7 [Adult, Fisherman (2009, 2010, 2011, 2012)] Penly /
0.8[Adult,Fisherman2013]/BivillesurMer[Adult,Fisherman2014]
9.10
-4
1.10
-3
1.10
-3
6.10
-4
7.10
-4
4.10
-4
EDF / Saint-Alban
Les Crès [Adult / 1.45] [Infant (2013)] /
Saint-Pierre de Bœuf / 2.3 [Infant 2014]
4.10
-4
4.10
-4
4.10
-4
4.10
-4
4.10
-4
2.10
-4
EDF / Saint-Laurent-des-Eaux
Port au Vin [Adult / 0.75] [Infant (2013)] /
Le Cavereau / 2.3 [Infant 2014]
3.10
-4
3.10
-4
3.10
-4
2.10
-4
2.10
-4
2.10
-4
EDF / Tricastin
Clos du Bonneau / 1.25, Le Trop Long (2009, 2010, 2011,
2012, 2013) / 1.35 [Adult (2014),
[Infant (2009, 2010, 2011, 2012, 2013)]
7.10
-4
9.10
-4
7.10
-4
7.10
-4
5.10
-4
2.10
-4
Ganil / Caen
IUT / 0.6 [Adult]
3.10
-3
<3.10
-3
<3.10
-3
<3.10
-3
<2.10
-3
<2.10
-3
ILL / Grenoble
Fontaine / 1 (gaseous discharges) and
Saint-Egrève (liquid discharges) / 1.4 [Infant]
1.10
-4
1.10
-4
5.10
-5
1.10
-4
2.10
-4
3.10
-4
a: until 2008, for installations operated by EDF, only “adult” figures are calculated. From 2009 to 2012, the dose of the most exposed reference group of each site for the two
age classes (adult or infant) is mentioned. As of 2013, the dose of the reference group is provided for three age classes (adult, child, infant) for all the BNIs.
b: because the outfall for the liquid discharges is geographically distant from the stack, two impact calculations are performed. One reflects the aggregate of maximum impact
of gaseous discharges plus maximum impact of liquid discharges. The other corresponds to an actual reference group.
c: as the site has no longer had radioactive discharges since 2014, the radiological impact caused by radioactive discharges is thus nil for the year 2014.
For the year 2014, CEA did not give the total dose for each site, but estimations of the doses calculated per radionuclide with a threshold of 0.01 µSv (when the estimated impact
is below 0.01 µSv, the value given is < 0.01 µSv). On the basis of these data, the impact for each site was evaluated taking account of the value of 0.01 µSv for radionuclides
for which the impact was declared to be lower than this threshold.
* Information not provided by the licensee.
4.1.2 Evaluating the radiological impact
of the facilities
In accordancewith the optimisationprinciple, the licensee
must reduce the radiological impact of its facility to values
that are as lowas possible under economically acceptable
conditions.
The licensee is required to assess the dosimetric impact
of its activity. As applicable, this obligation is the result
of Article L. 1333-8 of the Public Health Code, or the
regulations concerningBNI discharges (Article 5.3.2of ASN
resolution 2013-DC-0360 of 16th July 2013 concerning
control of detrimental effects and the impact of basicnuclear
installations on health and the environment). The result
must be compared with the annual dose limit for the
public (1 mSv/year) defined in Article R.1333-8 of the
Public Health Code. This regulation limit corresponds
to the sumof the effective doses received by the public as
a result of nuclear activities.
In practice, only traces of artificial radioactivity are
detectable in the vicinity of the nuclear facilities; most
measurements takenduring routine surveillance are below
thedecision thresholdor reflect thenatural radioactivity. As
thesemeasurements cannot be used for dose estimations,
models for the transfer of radioactivity to humans must
be used, on the basis of measurements of discharges from
the installation. Thesemodels are specific to each licensee.
They are detailed in the installation’s impact assessment.
During its assessment, ASNverifies that thesemodels are
conservative, inorder to ensure that the impact assessments
will in no case be underestimated.
In addition to the impact assessments produced on the
basis of discharges from the facilities, the licensees are
requiredtocarryoutenvironmentalradioactivitymonitoring
programmes (water, air, earth, milk, grass, agricultural
produce, etc.),more specifically to verify compliancewith
the hypotheses of the impact assessment and to monitor
changes in the radioactivity in the various compartments
of the environment around the facilities (see point 4.1.1).
Anestimationof thedoses fromBNIs is presented in table 7.
For each site andper year, this table gives the effective doses
receivedby themost exposed reference populationgroups.
The doses from BNIs for a given year are determined on
the basis of the actual discharges from each installation
for the year in question. This assessment takes account
of the discharges through the identified outlets (stack,
discharge pipe to river or seawater). It also includes diffuse
emissionsandsourcesofradiologicalexposuretotheionising
151
CHAPTER 04:
REGULATION OF NUCLEAR ACTIVITIES AND EXPOSURE TO IONISING RADIATION
ASN report on the state of nuclear safety and radiation protection in France in 2015