


 57 / 536

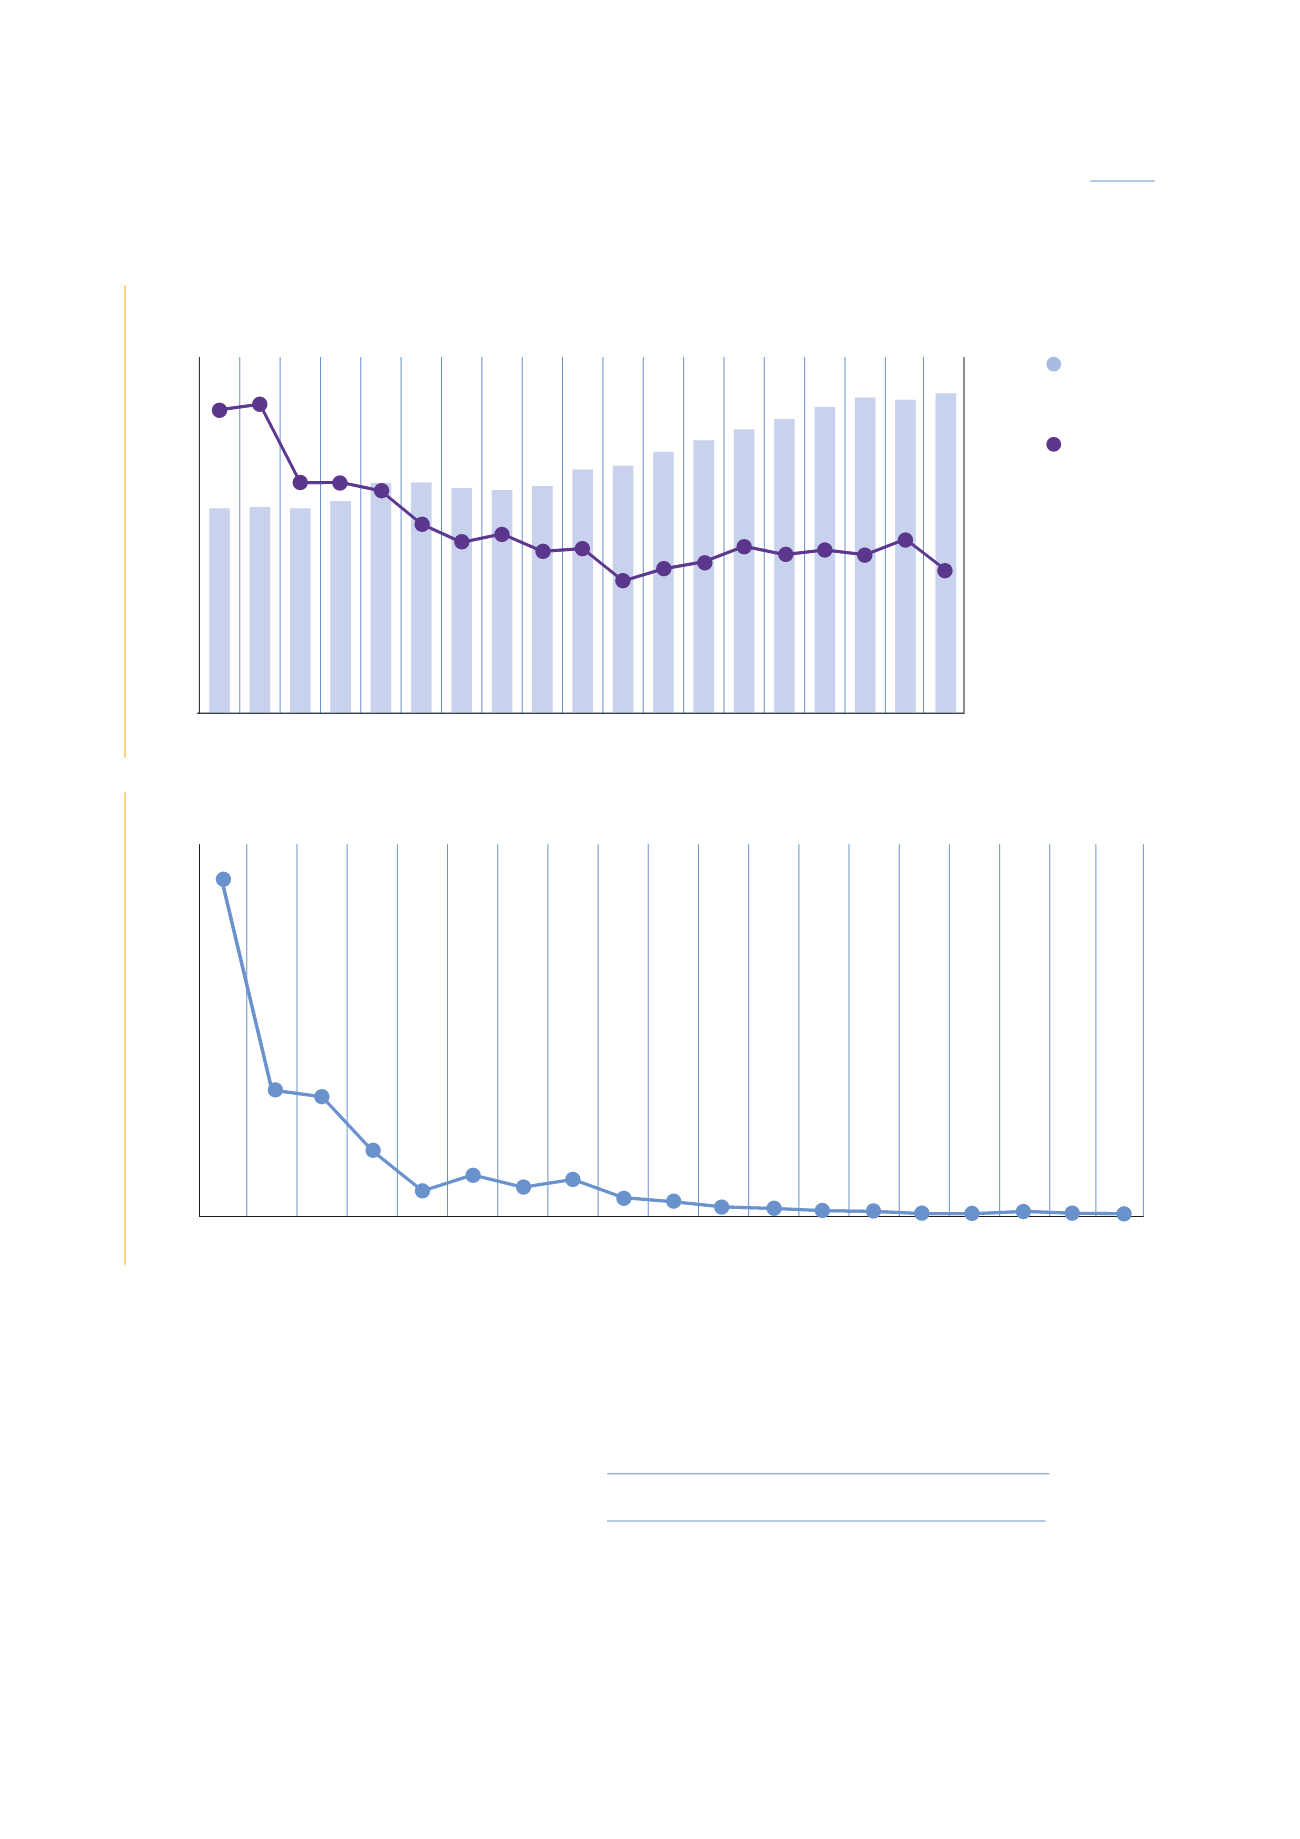
The number of monitored workers whose annual
effective dose exceeded 20 mSv has remained stable
since 2013 (nine exceedances of the effective dose limit)
(see diagram 3).
With regard to the dosimetry of the extremities (fingers
and wrist), 27,068 workers were monitored in 2014
(i.e. 7.5%of the total number of persons monitored) and
the total dose was 129 man-Sv. Out of all the persons
monitored, there was one case where the 500 mSv
regulatory equivalent dose limit at the extremities was
exceeded (about 1,373 mSv for a medical worker).
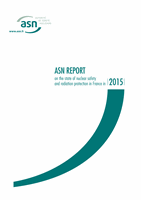
The results of dosimetric monitoring of worker external
exposure in 2014 published by IRSN in July 2015 show
on the whole that the prevention system introduced in
facilities where sources of ionising radiation are used is
effective, because for more than 96% of the population
monitored, the annual dose remained lower than 1 mSv
(effective annual dose limit for the public as a result of
nuclear activities). Exceedances of the regulatory limit
values remain exceptional.
3.1.2 Worker exposure to TENORM (Technologically
Enhanced Naturally Occurring Radioactive Materials)
Occupational exposure to enhanced natural ionising
radiation is the result either of the ingestion of dust
containing large amounts of radionuclides (phosphates,
metal ore), or of the inhalation of radon formed by uranium
decay (poorly ventilated warehouses, thermal baths)
or of external exposure due to process deposits (scale
forming in piping for example).
DIAGRAM 2:
Monitored population and collective dose trends, from 1996 to 2014
2014
2013
2004
2003
2002
2001
2000
2009
2008
2007
2012
2011
2010
2006
2005
1999
1998
1997
1996
0
50,000
100,000
150,000
200,000
250,000
300,000
350,000
400,000
0
20
40
60
80
100
120
140
119.4
121.5
90.6
90.8 87.5
74.5
67.2
52.1
56.9 59.6
65.7 62.4 64.3
56.3
68.5
70.5
63.7 64.8
62.4
Source: IRSN.
DIAGRAM 3:
Evolution of number of workers monitored, with an annual effective dose in excess of 20 mSv from 1996 to 2014
0
100
200
300
400
500
600
700
800
900
1,000
2014
2013
2012
2011
2009 2010
2007 2008
2005 2006
2003 2004
2001 2002
1999 2000
1997 1998
1996
905
340
322
177
69
112
79
100
51
40
26
22
16
14
14
8
8
8
9
Source: IRSN.
Number of persons monitored
Collective dose (man-Sv)
Collective dose
(man-Sv)
Number of
persons
monitored
57
CHAPTER 01:
NUCLEAR ACTIVITIES: IONISING RADIATION AND HEALTH AND ENVIRONMENTAL RISKS
ASN report on the state of nuclear safety and radiation protection in France in 2015